qalgebra.printing.dot module
DOT printer for Expressions.
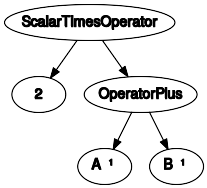
This module provides the dotprint() function that generates a DOT
diagram for a given expression. For example:
>>> A = OperatorSymbol("A", hs=1)
>>> B = OperatorSymbol("B", hs=1)
>>> expr = 2 * (A + B)
>>> with configure_printing(str_format='unicode'):
...     dot = dotprint(expr)
>>> dot.strip() == r'''
... digraph{
...
... # Graph style
... "ordering"="out"
... "rankdir"="TD"
...
... #########
... # Nodes #
... #########
...
... "node_(0, 0)" ["label"="ScalarTimesOperator"];
... "node_(1, 0)" ["label"="2"];
... "node_(1, 1)" ["label"="OperatorPlus"];
... "node_(2, 0)" ["label"="Â⁽¹⁾"];
... "node_(2, 1)" ["label"="B̂⁽¹⁾"];
...
... #########
... # Edges #
... #########
...
... "node_(0, 0)" -> "node_(1, 0)"
... "node_(0, 0)" -> "node_(1, 1)"
... "node_(1, 1)" -> "node_(2, 0)"
... "node_(1, 1)" -> "node_(2, 1)"
... }'''.strip()
True
The dot commandline program renders the code into an image:
The various options of dotprint() allow for arbitrary customization of
the graph’s structural and visual properties.
Summary
Functions:
Return the DOT (graph) description of an Expression tree as a string. |
|
Factory for function |
Reference
-
qalgebra.printing.dot.expr_labelfunc(leaf_renderer=<class 'str'>, fallback=<class 'str'>)[source]¶ Factory for function
labelfunc(expr, is_leaf)It has the following behavior:
If
is_leafis True, returnleaf_renderer(expr).Otherwise,
if expr is an Expression, return a custom string similar to
srepr(), but with an ellipsis forargsotherwise, return
fallback(expr)
-
qalgebra.printing.dot.dotprint(expr, styles=None, maxdepth=None, repeat=True, labelfunc=<function expr_labelfunc.<locals>._labelfunc>, idfunc=None, get_children=<function _op_children>, **kwargs)[source]¶ Return the DOT (graph) description of an Expression tree as a string.
- Parameters
expr (object) – The expression to render into a graph. Typically an instance of
Expression, but with appropriate get_children, labelfunc, and id_func, this could be any tree-like objectstyles (list or None) – A list of tuples
(expr_filter, style_dict)whereexpr_filteris a callable andstyle_dictis a list of DOT node properties that should be used when rendering a node for whichexpr_filter(expr)return True.maxdepth (int or None) – The maximum depth of the resulting tree (any node at maxdepth will be drawn as a leaf)
repeat (bool) – By default, if identical sub-expressions occur in multiple locations (as identified by idfunc, they will be repeated in the graph. If
repeat=Falseis given, each unique (sub-)expression is only drawn once. The resulting graph may no longer be a proper tree, as recurring expressions will have multiple parents.labelfunc (callable) – A function that receives expr and a boolean
is_leafand returns the label of the corresponding node in the graph. Defaults toexpr_labelfunc(str, str).idfunc (callable or None) – A function that returns the ID of the node representing a given expression. Expressions for which idfunc returns identical results are considered identical if repeat is False. The default value None uses a function that is appropriate to a single standalone DOT file. If this is insufficient, something like
hashorstrwould make a good idfunc.get_children (callable) – A function that return a list of sub-expressions (the children of expr). Defaults to the operands of an
Operation(thus, anything that is not an operation is a leaf)kwargs – All further keyword arguments set custom DOT graph attributes
- Returns
a multiline str representing a graph in the DOT language
- Return type
Notes
The node styles are additive. For example, consider the following custom styles:
styles = [
    (lambda expr: isinstance(expr, SCALAR_TYPES),
        {'color': 'blue', 'shape': 'box', 'fontsize': 12}),
    (lambda expr: isinstance(expr, Expression),
        {'color': 'red', 'shape': 'box', 'fontsize': 12}),
    (lambda expr: isinstance(expr, Operation),
        {'color': 'black', 'shape': 'ellipse'})]
For Operations (which are a subclass of Expression) the color and shape are overwritten, while the fontsize 12 is inherited.
Keyword arguments are directly translated into graph styles. For example, in order to produce a horizontal instead of vertical graph, use
dotprint(..., rankdir='LR').See also
sympy.printing.dot.dotprint()provides an equivalent function for SymPy expressions.